[ad_1]
If we do break it down below the $1680 level, then it is likely that things fall apart, and you can become much more aggressive in your position sizing.
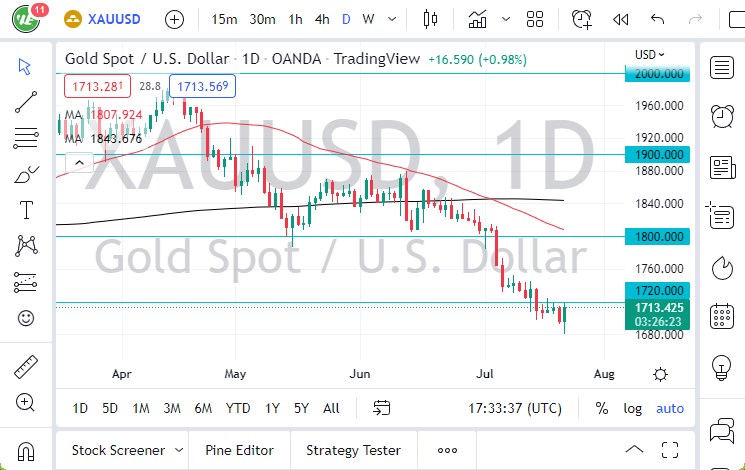
Gold markets have turned around quite drastically during the trading session on Thursday after initially hitting the crucial $1680 level. This is an area that is extraordinarily important from a longer-term standpoint, so the fact that we have held this level is probably the first truly good sign. Ultimately, by forming a market swing as we have during the day, we could be looking at a potential bottom.
Before we get too aggressive thinking that there is a bottom, we should also keep an eye on the fact that the US dollar has a major influence on this market. After all, the US dollar is exactly what sent the market lower, followed by what sent the market higher. After the ECB decided to raise interest rates by 50 basis points, the US dollar got sold off as a reaction. This of course helped the gold market, so whether or not we have any sustainability is a completely different question.
When I look at this chart, especially from the longer-term standpoint, the $1680 level is crucial to pay close attention to, because we break down below there we could see gold drop all the way down to $1500 without too much effort. After all, the market had shot straight up in the air from that level previously, and the $1680 level seems to be an area that the market is defending quite drastically. If we turn around and break to the upside, this could have been the bottom.
As far as defining the bottom, that is not going to be as easy. We would need to see this market break above the $1725 level initially, followed by the $1750 level. It probably isn’t truly confirmed until we break above the $1800 level, which obviously would take quite a bit of effort to make that happen. With this being the case, I think we are going to continue to see a lot of volatility, which can in fact be a bit of a factor in forming a bottom, so at this point in time, you probably need to focus more or less on the short-term charts. However, if we do break it down below the $1680 level, then it is likely that things fall apart, and you can become much more aggressive in your position sizing.

Ready to trade today’s Gold prediction? Here’s a list of some of the best XAU/USD brokers to check out.
[ad_2]

