[ad_1]
The best opportunity is likely to be long from supportive confluence.
My previous signal on 27th June was not triggered, as none of the key support and resistance levels were reached that day.
Today’s AUD/USD Signals
Risk 0.75%
Trades must be entered before 5pm Tokyo time Friday.
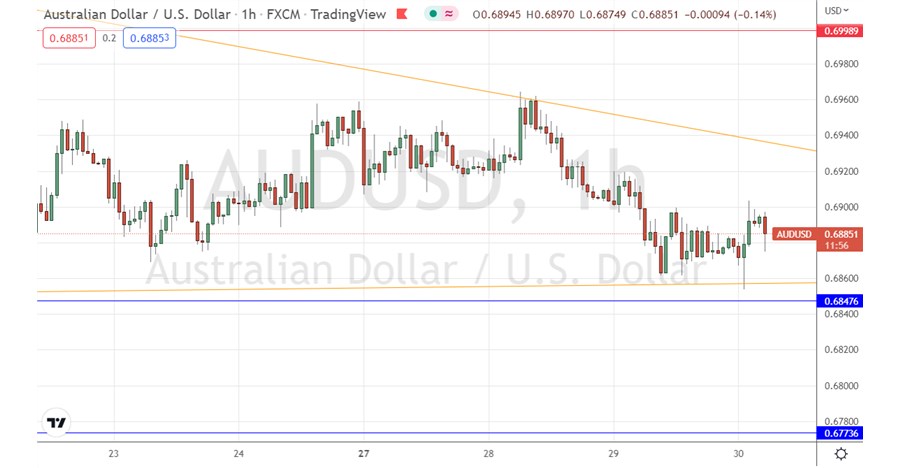
- Go short following a bearish price action reversal on the H1 time frame immediately upon the next touch of the descending trend line shown in the price chart below which currently sits at about 0.6943.
- Place the stop loss 1 pip above the local swing high.
- Move the stop loss to break even once the trade is 20 pips in profit.
- Remove 50% of the position as profit when the price reaches 20 pips in profit and leave the remainder of the position to ride.
Long Trade Ideas
- Go long following a bullish price action reversal on the H1 time frame immediately upon the next touch of 0.6848 or 0.6774.
- Place the stop loss 1 pip below the local swing low.
- Move the stop loss to break even once the trade is 20 pips in profit.
- Remove 50% of the position as profit when the price reaches 20 pips in profit and leave the remainder of the position to ride.
The best method to identify a classic “price action reversal” is for an hourly candle to close, such as a pin bar, a doji, an outside or even just an engulfing candle with a higher close. You can exploit these levels or zones by watching the price action that occurs at the given levels.
AUD/USD Analysis
I wrote in my previous forecast on 27th June that we had a fairly wide and choppy consolidation pattern playing out between the very big round number at 0.7000 which is acting as resistance, and the nearest support level at 0.6840. I thought that the price would remain between these levels, and it did. In fact, three days later it continues to do so.
The technical picture now remains consolidative but interesting, with the consolidation reinforced by a narrowing triangle formation which is holding the price, shown in the price chart below. The lower edge of this triangle is very close to what looks to be a strong support level at 0.6848, which already held a few hours ago.
I think the best opportunity which could set up here today would be a long from another rejection of this level at 0.6848. I am not so keen on a short trade from the top of the triangle at 0.6943.
If the price does break below 0.6848, and can end the day trading firmly lower, that would be a very bearish sign and suggest a continuing fall to new long-term lows would be likely. This would probably require another major downwards move in stocks to happen due to the Aussie’s status as a risk barometer.
 Concerning the USD, there will be a release of Core PCE Price Index data at 1:30pm London time. There is nothing of importance scheduled today regarding the AUD.
[ad_2]

