[ad_1]
Our expectations indicate more decline for the index during its upcoming trading.
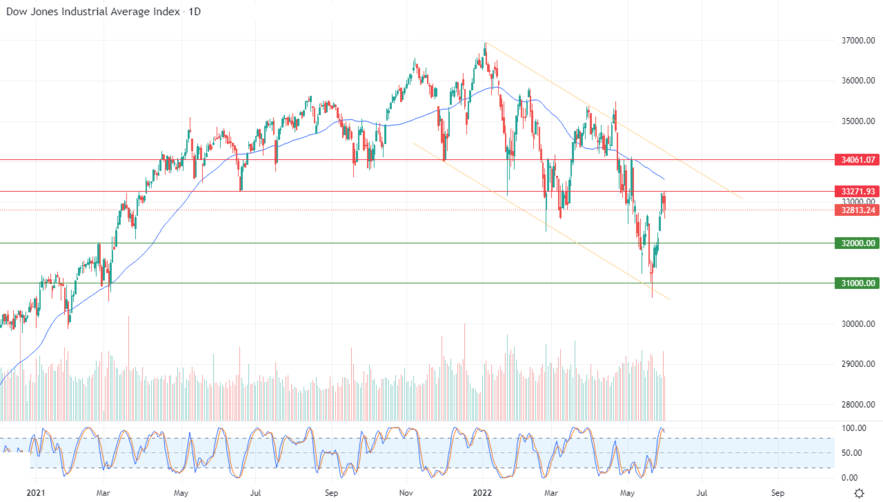
The Dow Jones Industrial Average declined during its recent trading at the intraday levels, to record losses for the second day in a row, by -0.54%, to lose the index towards -176.89 points. It settled at the end of trading at the level of 32,813.24, after it declined in Tuesday’s trading by -0.67%.
St. Louis Fed President James Bullard warned in a speech that the Fed was in danger of losing control of how much inflation US households expect. Meanwhile, San Francisco Fed President Mary Daly said on Wednesday that the time to pause interest rate hikes is when the Fed raises its benchmark interest rates to around 2.5%.
The Institute for Supply Management’s manufacturing index came in at 56.1 for the month of May, up from 55.4 in April, with any reading above 50 representing activity growth. New orders grew indicating that manufacturers are anticipating strong demand even with higher interest rates.
Jobs remained near record levels in April, with 11.4 million jobs created, the Labor Department reported Wednesday. Recently there were about 1.9 jobs for every unemployed person.
More economic data to come, jobless claims are due on Thursday, and then the jobs report for May will be released on Friday. Economists are looking to add 328,000 jobs, which will be down from the 428,000 jobs added in April.
Technically, the index’s decline came as a result of the stability of the important resistance level 33,271.90, with the beginning of the emergence of a negative intersection with the relative strength indicators. This is after they reached areas of severe overbought, in an exaggerated manner compared to the movement of the index, which suggests the beginning of a negative divergence in it. All of this comes under the control of the corrective bearish trend and the index’s trading within its price channel range. This is shown in the attached chart for a (daily) period, in addition to the continuation of the negative pressure for its trading below the simple moving average for the previous 50 days.
Therefore, our expectations indicate more decline for the index during its upcoming trading, as long as the resistance level 33,271.90 remains intact, to target the main support level 32,000.

[ad_2]

