[ad_1]
Our expectations indicate a further decline for the index during its upcoming trading.
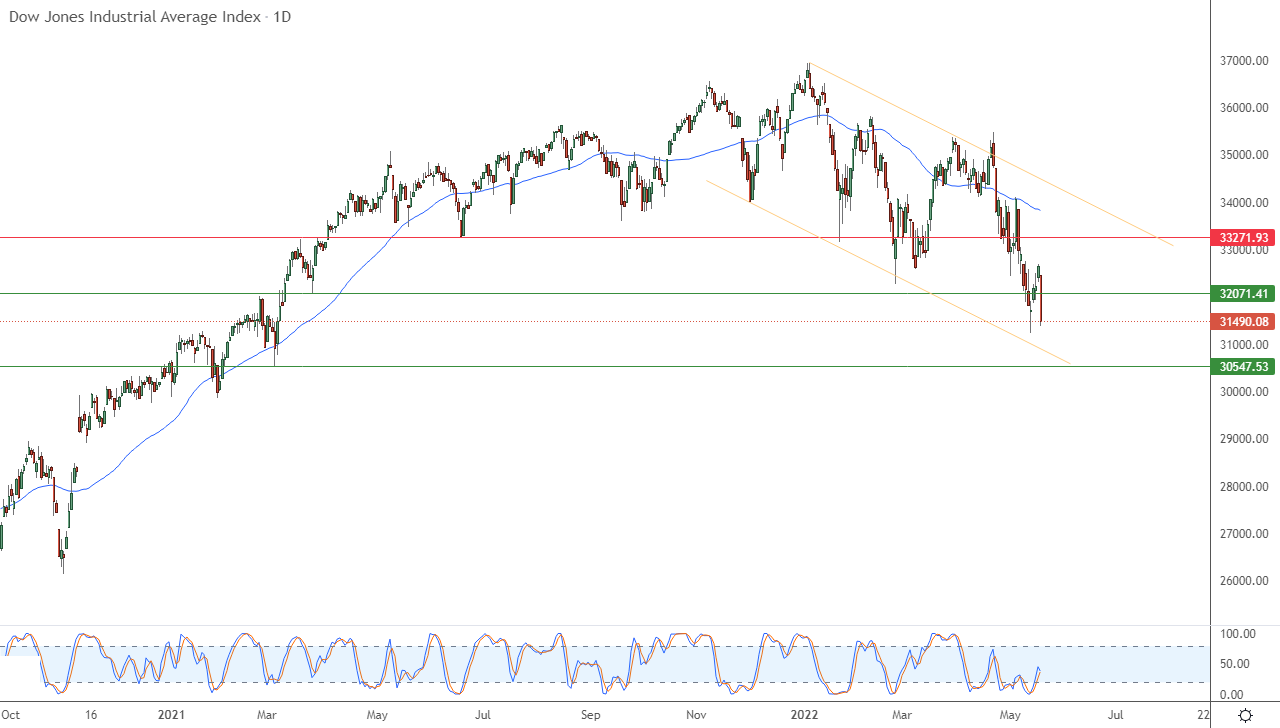
The Dow Jones Industrial Average slipped during its recent trading at the intraday levels, to break a series of gains that lasted for three sessions, to incur losses in its last sessions by -3.57%. It lost about -1,164.52 to settle at the end of trading at the level of 31,490.08, after rising in trading on Tuesday by 1.34%.
Current volatility is making great stock trading opportunities – don’t miss out!
All 30 components of the index declined, with Walgreens Boots Alliance Inc., leading the stocks by percentage. by -8.48%, followed by Coca-Cola Co. by -6.96%, followed by Walmart Inc. Which recorded a loss of -6.79%.
The index recorded its worst day since June of 2020, amid persistent fears of stagflation and rising costs that undermine corporate profits, especially retail companies.
Data released on Wednesday showed housing starts in the US fell 0.2% to an annual pace of 1.72 million last month, indicating that higher mortgage rates, record home prices and the rising cost of building materials are starting to emerge. Economists had expected housing starts to come in at a rate of 1.75 million after taking into account typical seasonal fluctuations in demand. Meanwhile, the number of building permits fell 3.2% to 1.82 million.
Wednesday’s weakness came as investors worried that they shrugged off deeply disappointing results from Walmart Inc. WMT the day before, as Target Corp. TGT also said that it saw its profits affected by the rise in labor and fuel costs which led to losses in the retail sector.
Meanwhile, US Treasury Secretary Janet Yellen warned on Wednesday of the fallout from the Russian war in Ukraine that could lead to stagflation for the global economy, as rising food and energy prices lower production and spending around the world, while speaking ahead of ministerial meetings. Finance of the Group of Seven in Germany.
Technically, the index has surrendered to negative pressures on it, as it moves within the range of a bearish corrective price channel that limits its previous trading in the short term, as shown in the attached chart for a (daily) period, with the negative pressure continuing for its trading below the simple moving average for the previous 50 days, despite the trend Positive signals with RSI indicators.
Therefore, our expectations indicate a further decline for the index during its upcoming trading, especially throughout its stability below the 32,000 level, to target the support level 31,490.

[ad_2]

