[ad_1]
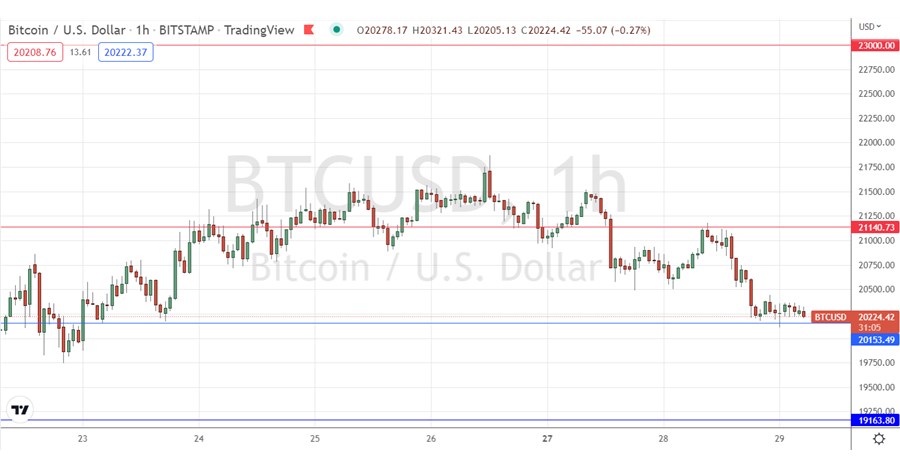
The support level at $20,153 is under threat.
Previous BTC/USD Signal
My previous signal on last Thursday produced a minor short trade which broke even, setting up after the price action rejected the descending trend line shown in the price chart that day.
Today’s BTC/USD Signals
Risk 0.50% per trade.
Trades must be taken prior to 5pm Tokyo time Thursday.
Long Trade Ideas
- Go long after a bullish price action reversal on the H1 timeframe following the next touch of $20,153 or $19,164.
- Place the stop loss $100 below the local swing low.
- Adjust the stop loss to break even once the trade is $100 in profit by price.
- Take off 50% of the position as profit when the trade is $100 in profit by price and leave the remainder of the position to run.
Short Trade Idea
- Go short after a bearish price action reversal on the H1 timeframe following the next touch of $21,141.
- Place the stop loss $100 above the local swing high.
- Adjust the stop loss to break even once the trade is $100 in profit by price.
- Take off 50% of the position as profit when the trade is $100 in profit by price and leave the remainder of the position to run.
The best method to identify a classic “price action reversal” is for an hourly candle to close, such as a pin bar, a doji, an outside or even just an engulfing candle with a higher close. You can exploit these levels or zones by watching the price action that occurs at the given levels.
BTC/USD Analysis
I wrote in my previous analysis last Thursday that I saw the outlook as remaining basically bearish if the price remained below the descending trend line, but I also noted we have seen buying below the big round number at $20k so we might see a pause in the trend here, or even a temporary reversal.
This was a good call as this did produce a short trade although one that barely made any profit at all, as the price initially moved down from the trend line.
However, the technical picture has become less bearish and more consolidative, as my note that the price may not be able to stay below $20k has been timely – we are still seeing buying down there, probably from long-term strong hands.
The short-term action is bearish and suggests that the price may well now break down below the support level at $20,153. A problem for trades is that the two closest key levels both look very questionable. It is the more distant levels at $23k and $19,164 which look likely to be more reliable as support and resistance.
I see the best potential opportunity which might set up today as a long trade from a bullish bounce at or very close to $19,164. First, the price will have to break down below $20,153 and fall quite strongly.
A daily close below $19,164 at the end of the New York session would be a very bearish sign and suggest that the price is ready to begin another leg down to the next key support level at $13,764.
 There is nothing of high importance scheduled today concerning the US Dollar or Bitcoin.
[ad_2]

