[ad_1]
While it looks bullish, noticing how we close at the end of the day on Friday could also be used as a potential entry.
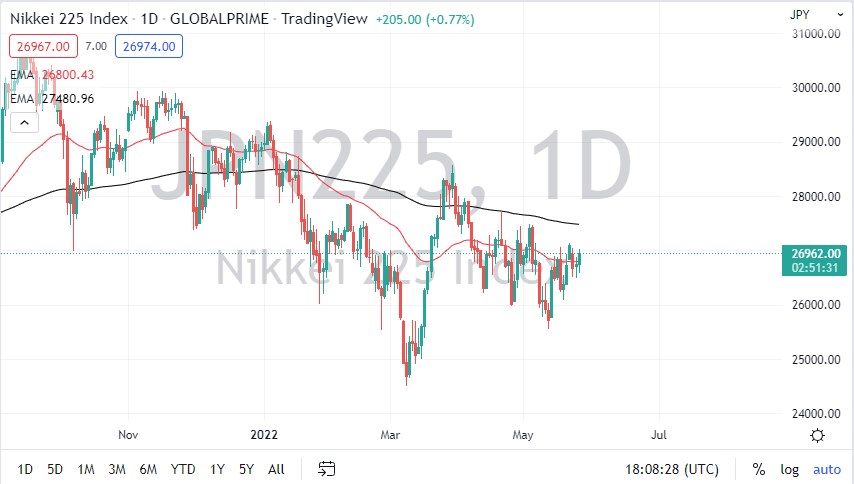
The Japanese index initially pulled back during the session on Thursday but then turned around to show signs of life. The market is currently threatening the ¥27,000 level, which happens to coincide quite nicely with a downtrend line that makes up the top of the channel that I have marked on the chart. If we can break above there, then it’s likely that we go looking to the €27,500 level next. What’s interesting about that level is that it also includes the 200 Day EMA.
If we do turn around and break down below the ¥26,500 level, then it’s likely that we go looking to reach the ¥26,000 level underneath. After that, then you are looking at a potential move down to the ¥25,600 level. We are testing the top of the channel at the moment, so the Friday session is going to be crucial. In fact, it’s why I picked this market to analyze during the trading session because I realize that this could be a harbinger of where Europe goes heading into the weekend.
If Asia has a good Friday session, is very likely that we will see that follow through on not only the European continent but possibly the North American continent. It’s worth noting that the S&P 500 rallied quite nicely late Thursday, which could lead to more buying when it comes time for the Japanese to get involved. However, you should also keep in mind that a lot of this is going to come down to the prospects of exports, which is something that’s a little bit trickier than a simple technical pattern. After all, Japan is a heavily export-laden economy, and this of course means that the Nikkei 225 is going to be sensitive to the rest of the world.
Market participants will have to keep an eye on the Japanese yen, because if it suddenly appreciates too much, then exporters start to get worried, and of course, so do market participants as it would have such a negative effect on earnings. All things being equal though, it is worth noting that the most recent pullback was much shallower than the ones before it, so this could be yet another sign that we are about to see a stock market rally, at least in the short term. While it looks bullish, noticing how we close at the end of the day on Friday could also be used as a potential entry.

[ad_2]
