[ad_1]
Our expectations are for a further corrective decline for the index during its upcoming trading.
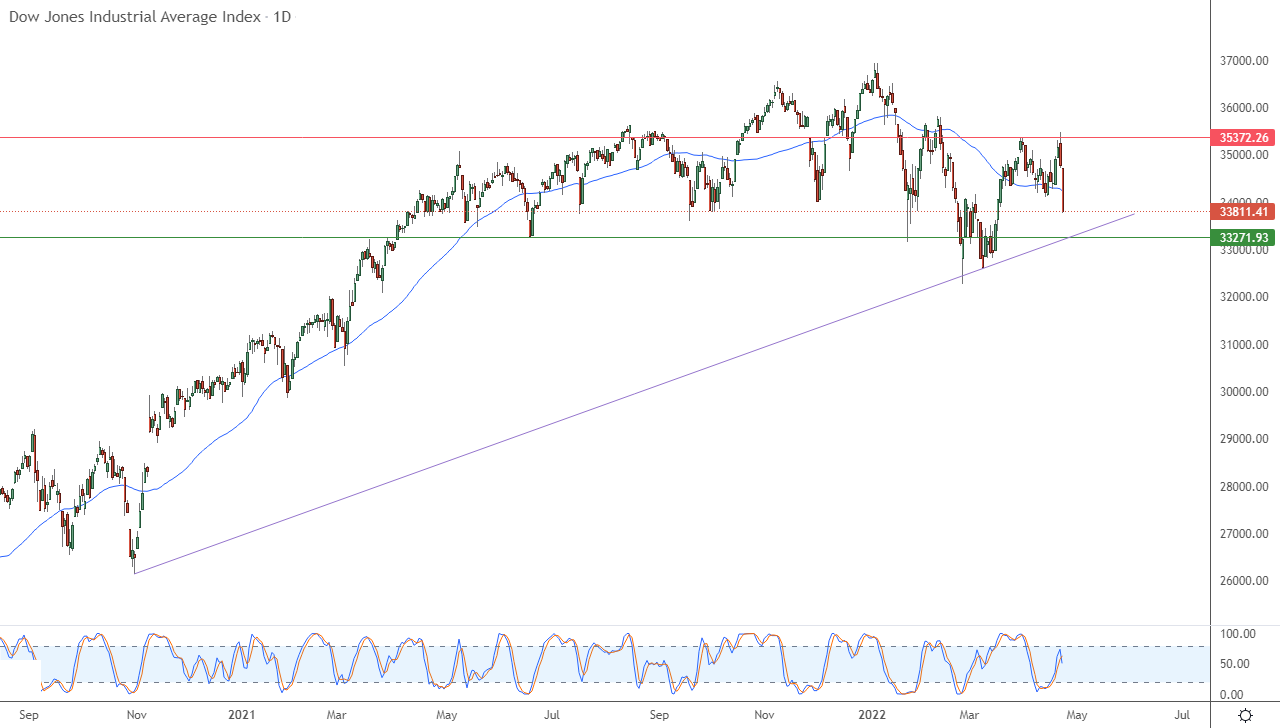
The Dow Jones Industrial Average slipped down during its recent trading at the intraday levels, to incur losses in its last sessions by -2.82%. It then lost the index towards -981.36 points to settle at the end of trading at the level of 33,811.41, after its decline in trading on Thursday by -1.05%. The index recorded a fourth consecutive weekly loss of -1.86%.
All 30 components of the index declined, with Caterpillar Inc. share leading the list of the most declining stocks by percentage. Which fell by -6.55%, followed by Verizon Communications Inc. by -5.64% and Nike Inc. Cl B at -4.72%.
The reason for the pressure on the index appeared to be the escalating intensity of the Federal Reserve’s rhetoric to dramatically and rapidly increase monetary policy in the face of rising inflation that threatens to derail the economic recovery.
Price traders responded by ramping up bets for a 50bp rate hike for the next three meetings of the Federal Open Market Committee. The US preliminary GDP growth is due on Tuesday, which will show how much the economy has grown during the month of March.
This led to a rebound in long-term Treasuries, which reached their highest levels since 2018.
Technically, the index in its recent trading was subjected to negative pressure as a result of surpassing the support of its simple moving average for the previous 50 days, in light of the dominance of the corrective bearish trend in the short term, which means the possibility of seeing more corrective declines in the coming period, especially with the emergence of a negative crossover in the strength indicators. After reaching overbought areas, this comes in light of the index’s trading along a major bullish slope line in the medium term, as shown in the attached chart for a (daily) period, which may put an end to those corrective declines in the index.
Therefore, our expectations are for a further corrective decline for the index during its upcoming trading, as long as the resistance level 35,372 remains intact, to target the first support levels at 33,272.

[ad_2]

