[ad_1]
The quicker the rate of change, the more likely it is to cause problems for the stock market overall.
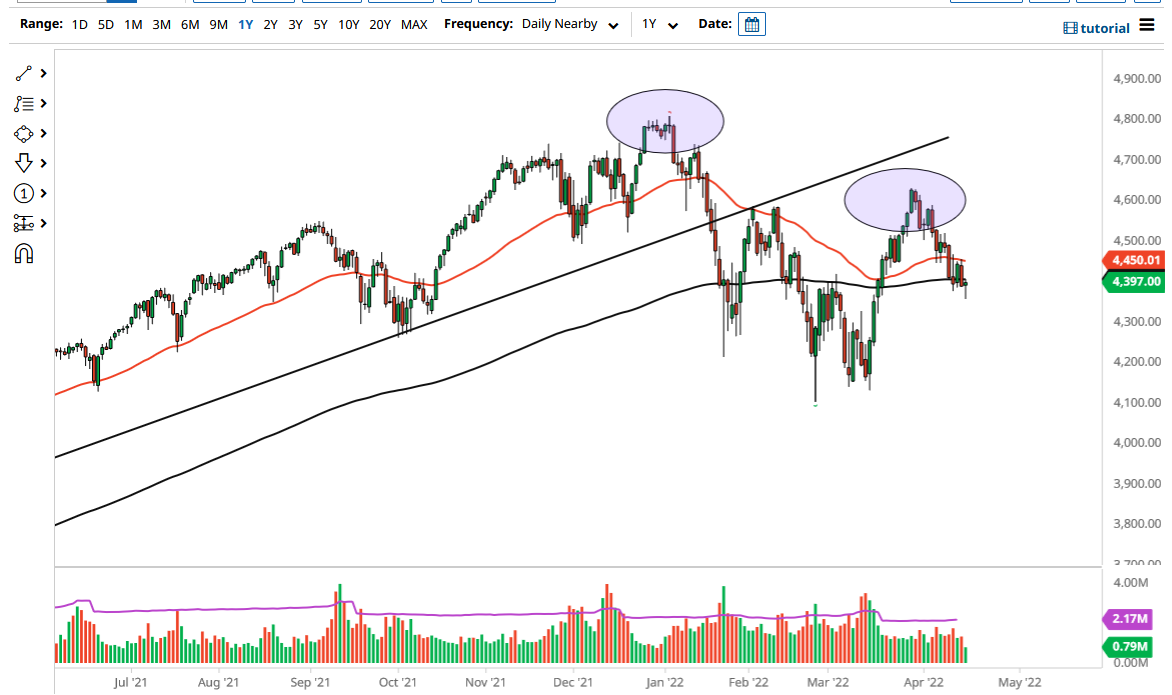
The S&P 500 futures initially fell during the trading session on Monday, reaching the 4360 handle before turning around. By doing so, it looks as if the market is trying to pick itself back up, and perhaps continue the overall consolidation that we have seen for the last couple of days. That being said, it is also worth noting that the candlestick was a hammer, and that could send this market looking to the 50 Day EMA above. That indicator currently sits at the 4450 handle, which is an area that a lot of traders have been paying close attention to, and that should be an area where we see sellers again.
The market breaking down below the bottom of the hammer for the session on Monday could open up fresh selling, perhaps reaching the 4300 level, followed by the 4150 level. The market continues to struggle with the idea of inflation, and what the Federal Reserve will have to do to fight it. The interest rates are going higher, so now the question is whether or not the interest rates scream higher, or if they simply gradually go higher. The quicker the rate of change, the more likely it is to cause problems for the stock market overall.
The S&P 500 has been running on liquidity for 14 years and does not necessarily have anything to do with the real economy. Because of this, the only thing that matters will be what happens with the Federal Reserve. The markets continue to have the occasional bullish day where people start to think that the Federal Reserve will not raise interest rates aggressively, but with so many the Federal Reserve speakers this week is going to be very noisy, and therefore it is very likely that we will continue to see this market get whipped around.
If a recession does, rather soon, that will continue to put negativity in this market, and thereby cause major issues. It would make a certain amount of sense to retest the bottom, so I do think that is ultimately what happens. However, if we were to take out the 4500 level on a move higher, then it is possible that we could see this market look to reach the 4600 level, and perhaps even turn the whole thing around. That does not seem the most likely of outcomes right now though.

[ad_2]

